Acid base titration end point detection
How do we detect end point of the acid-base titration?
Short answer is - when indicator changes its color.
However, color change is not instant (see acid-base indicators). Sometimes it seems like it is - very small drop of the titrant completely changes solution color, but sometimes - depending on the concentration of titrant and titrated substance, as well as on the selected indicator - we have to add even several milliliters of titrant before color change will come to an end.
So, when should we stop the titration?
Longer answer is - we should take into account indicator type and concentrations of acid and titrant, as well as their strength. Could be we have to titrate to the very first change in indicator hue, could be we should wait till color change is complete, could be we should look for completely different indicator, as the one selected doesn't guarantee accuracy.
OK, but how do we know which indicator, which change, and why?
That will require delving into details.
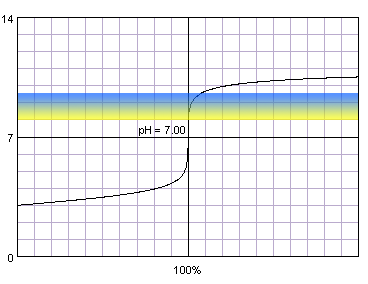
Following titration curves, partially already presented in the general end point detection section, show pH changes during titration and color changes of three popular indicators - methyl red, thymol blue and phenolphthalein:
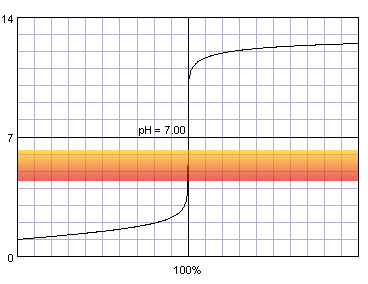
0.1 M strong monoprotic acid titrated with 0.1 M strong monoprotic base in the presence of the methyl red indicator. Note that while only color change area is marked on the plot, solution is red for lower pH and orange for higher pH. Titration curve calculated with BATE - pH calculator.
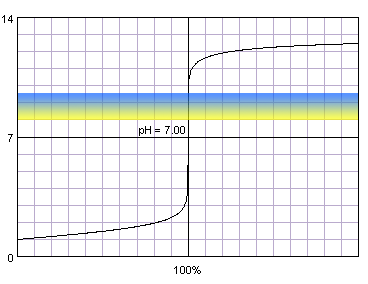
0.1 M strong monoprotic acid titrated with 0.1 M strong monoprotic base in the presence of the thymol blue. Note that while only color change area is marked on the plot, solution is yellow for lower pH and blue for higher pH. Titration curve calculated with BATE - pH calculator.
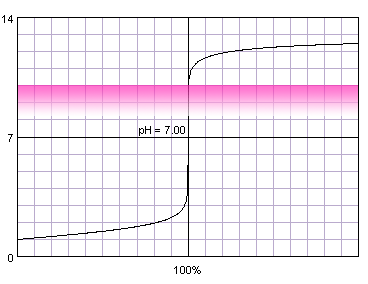
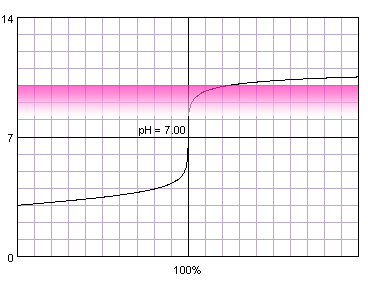
0.1 M strong monoprotic acid titrated with 0.1 M strong monoprotic base in the presence of the phenolphthalein. Note that while only color change area is marked on the plot, solution is pink for higher pH. Titration curve calculated with BATE - pH calculator.
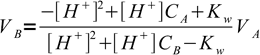
Judging from the plots colors of all indicators change completely while we are on the steep part of the curve. As the horizontal axis reflects volume of the titrant added, it seems logical that fast pH change in response to small volumes of titrant should ensure small error of the titration. But 'small' is not a very exact way of stating titration error. Let's try to find it more precisely. For that we can calculate exact volumes of the titrant that have to be added to the solution to change indicator color. We will use formula derived in the acid-base titration curve calculation section:
 1
1that for known pH value allows easy calculation of a volume of the titrant (strong base in this case) that was added added to a strong acid.
| indicator name | color change start pH | Vb (mL) | color change end pH | Vb (mL) | ΔVb (mL) |
|---|---|---|---|---|---|
| 2,4-Dinitro phenol | 2.8 | 48.4398 | 4.7 | 49.9801 | 1.5402 |
| Methyl orange | 3.1 | 49.2119 | 4.4 | 49.9602 | 0.7483 |
| Bromocresol green | 3.8 | 49.8418 | 5.4 | 49.9960 | 0.1543 |
| Methyl red | 4.4 | 49.9602 | 6.2 | 49.9994 | 0.0392 |
| Chlorophenol red | 4.8 | 49.9842 | 6.4 | 49.9996 | 0.0155 |
| Litmus | 5.0 | 49.9900 | 8.0 | 50.0010 | 0.0110 |
| Bromothymol blue | 6.0 | 49.9990 | 7.6 | 50.0004 | 0.0014 |
| Neutral red | 6.8 | 49.9999 | 8.0 | 50.0010 | 0.0011 |
| m-Cresol purple | 7.4 | 50.0002 | 9.0 | 50.0100 | 0.0098 |
| Thymol blue | 8.0 | 50.0010 | 9.6 | 50.0398 | 0.0388 |
| Phenolphthalein | 8.2 | 50.0016 | 9.8 | 50.0631 | 0.0616 |
| Alizarin yellow GG | 10.0 | 50.1001 | 12.1 | 64.4024 | 14.3023 |
We have assumed both titrant and titrated substance concentrations to be 0.1 M and initial volume of the acid to be 50 mL. Volumes marked green are less than 0.05 mL from the equivalence volume.
For four indicators (three first and the last) volume of the titrant that have to be added for a complete color change is relatively large - even over 14 mL for alizarin yellow. However, all of the indicators that start to change color above pH 4.4 and end color change below pH 9.6 require addition of less than 0.04 mL of titrant to completely change their color. What is also very important, for these indicators both beginning of the color change and end of the color change happen less then 0.05 mL from the equivalence volume of the titrant. As we have already signalled in end point detection section, 0.05 mL difference is comparable with the smallest amount of titrant that we can add to the solution and is identical to the accuracy of the A class burette. That means that for all those indicators it wont matter whether we will end titration at the first color change or once the change is complete - error will be lower than 0.2% (sum of distance from the equivalence point and burette accuracy, we are assuming the worst case - so (0.05mL+0.05mL)/50mL×100%).
If 0.2% is too large, we can titrate to either first color change, or complete color change - and without need for some more exotic indicators we can be less then than 0.01 mL from the equivalence point, which should ensure 0.1% titration error (assuming 0.05 mL burette accuracy). However, in practice it won't work that way. As the smallest volume we can add is about 0.04-0.05 mL, we will have to be very lucky to not overshoot color change.
For two indicators color changes fall short of the 4.4-9.6 range. In the case of bromocresol green if we end titration once the color change is complete we will be 0.0001 mL (0.1 μL) from the quivalence point, in the case of phenolphthalein if we end titration at first sight of the color change we are 0.0016 mL (1.6 μL) from the equivalence point. For all practical purposes this IS equivalence point - and in practice we will be never able to add exactly required volue.
In the case of more diluted reagents initial plateau shifts up, final plateau shifts down, and steep part of the curve becomes shorter:

0.001 M strong monoprotic acid titrated with 0.001 M strong monoprotic base in the presence of the methyl red indicator. Note that while only color change area is marked on the plot, solution is red for lower pH and orange for higher pH. Titration curve calculated with BATE - pH calculator.
0.001 M strong monoprotic acid titrated with 0.001 M strong monoprotic base in the presence of the thymol blue. Note that while only color change area is marked on the plot, solution is yellow for lower pH and blue for higher pH. Titration curve calculated with BATE - pH calculator.
0.001 M strong monoprotic acid titrated with 0.001 M strong monoprotic base in the presence of the phenolphthalein. Note that while only color change area is marked on the plot, solution is pink for higher pH. Titration curve calculated with BATE - pH calculator.
It is obvious now that color changes either start too early on the titration curve, or end too late. To check details we will prepare similar table as the one shown above, this time for diluted acid (and base).
| indicator name | color change start pH | Vb (mL) | color change end pH | Vb (mL) | ΔVb (mL) |
|---|---|---|---|---|---|
| 2,4-Dinitro phenol | 2.8 | ??? | 4.7 | 48.0438 | ??? |
| Methyl orange | 3.1 | 5.7312 | 4.4 | 46.1714 | 40.4402 |
| Bromocresol green | 3.8 | 36.3193 | 5.4 | 49.6037 | 13.2844 |
| Methyl red | 4.4 | 46.1714 | 6.2 | 49.9385 | 3.7672 |
| Chlorophenol red | 4.8 | 48.4399 | 6.4 | 49.9627 | 1.5228 |
| Litmus | 5.0 | 49.0100 | 8.0 | 50.0991 | 1.0891 |
| Bromothymol blue | 6.0 | 49.9011 | 7.6 | 50.0373 | 0.1362 |
| Neutral red | 6.8 | 49.9905 | 8.0 | 50.0991 | 0.1086 |
| m-Cresol purple | 7.4 | 50.0211 | 9.0 | 51.0100 | 0.9889 |
| Thymol blue | 8.0 | 50.0991 | 9.6 | 54.1461 | 4.0470 |
| Phenolphthalein | 8.2 | 50.1581 | 9.8 | 56.7345 | 6.5864 |
| Alizarin yellow GG | 10.0 | 61.1111 | 12.1 | ??? | ??? |
We have assumed both titrant and titrated substance concentrations to be 0.001 M and initial volume of the acid to be 50 mL. Volumes marked green are less than 0.05 mL from the equivalence volume. ??? marks pH values that can be not obtained mixing given titrant and titrated substance solutions.
Analysis of the plots and table clearly shows, that when using diluted titrant and diluted titrated substance, selection of indicator starts to play important role. Not only that - now, we have to much more precisely observe color changes. For example if we will titrate acid against thymol blue and we will stop titration at first sight of the color change, volume of the titrant used will be 50.0991 mL - that keeps us in the 0.3% error range ((0.0991mL+0.05mL)/50mL×100%). However, if we will titrate to the end of the color change (which is a sound approach in the case of more concentrated acid) we will overshoot our end point by over 4 mL, that is over 8% error. Similarly, using methyl red, we have to titrate till full color change, as when the first color change is observed we are 3.73 mL short of the equivalence point.
It is interesting to observe how methyl orange applicability changes depending on the titrated acid concentration. For diluted acid methyl orange is useless - when it has completely changed its color, we are still 3.73 mL before equivalence point. For concentrated acid methyl orange can be used, but we have to titrate till the full color change, as first observable changes occur too early, about 0.79 mL before equivalence point. That's not the error we can accept.
In the case of a weak acid titrated with a strong base, initial acid pH is higher, thus the steep part of the curve is short even for concentrated solutions:
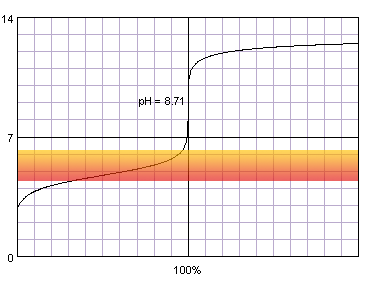
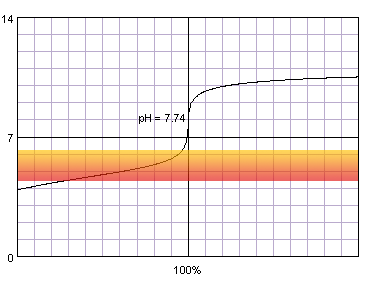
0.1 M acetic acid titrated with 0.1 M strong monoprotic base in the presence of the methyl red. Note that while only color change area is marked on the plot, solution is red for lower pH and orange for higher pH. Titration curve calculated with BATE - pH calculator.
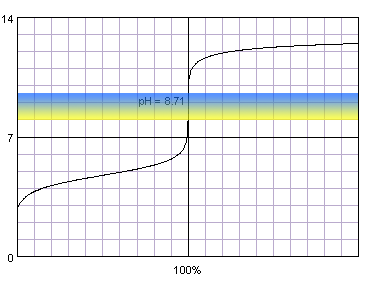
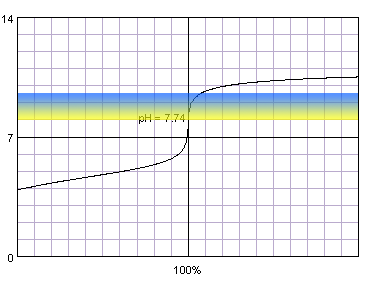
0.1 M acetic acid titrated with 0.1 M strong monoprotic base in the presence of the thymol blue. Note that while only color change area is marked on the plot, solution is yellow for lower pH and blue for higher pH. Titration curve calculated with BATE - pH calculator.
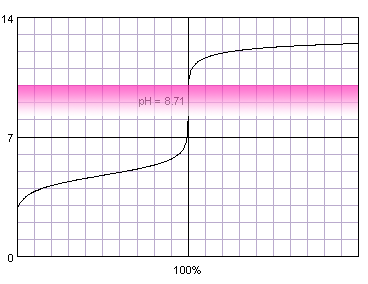
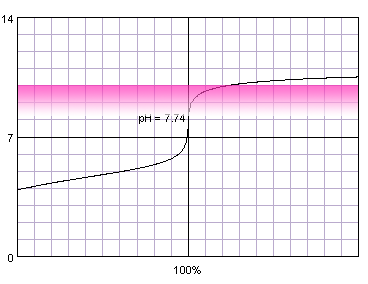
0.1 M weak monoprotic acid titrated with 0.1 M strong monoprotic base in the presence of the phenolphthalein. Note that while only color change area is marked on the plot, solution is pink for higher pH. Titration curve calculated with BATE - pH calculator.
Judging from the plots methyl red is completely useles for the acetic acid titration, as it completely changes color well before the inflection point. Thymol blue seems to be a good selection, as it seems to both start and complete color change close to the equivalence point. Also phenolphthalein looks prmising. That's nothing strange, taking into account fact, that calculated equivalence point for 0.1M acetic acid is 8.71, almost exactly in the middle of the thymol blue color change pH range, and slightly above the lower limit of the pH range in which phenolphthalein changes color.
| indicator name | color change start pH | Vb (mL) | color change end pH | Vb (mL) | ΔVb (mL) |
|---|---|---|---|---|---|
| 2,4-Dinitro phenol | 2.8 | ??? | 4.7 | 23.3471 | ??? |
| Methyl orange | 3.1 | 0.6752 | 4.4 | 15.2407 | 14.5656 |
| Bromocresol green | 3.8 | 4.8845 | 5.4 | 40.7293 | 35.8448 |
| Methyl red | 4.4 | 15.2407 | 6.2 | 48.2592 | 33.0185 |
| Chlorophenol red | 4.8 | 26.2245 | 6.4 | 48.8874 | 22.6628 |
| Litmus | 5.0 | 31.8090 | 8.0 | 49.9724 | 18.1634 |
| Bromothymol blue | 6.0 | 47.2961 | 7.6 | 49.9287 | 2.6326 |
| Neutral red | 6.8 | 49.5511 | 8.0 | 49.9724 | 0.4213 |
| m-Cresol purple | 7.4 | 49.8867 | 9.0 | 50.0071 | 0.1204 |
| Thymol blue | 8.0 | 49.9724 | 9.6 | 50.0391 | 0.0667 |
| Phenolphthalein | 8.2 | 49.9836 | 9.8 | 50.0627 | 0.0791 |
| Alizarin yellow GG | 10.0 | 50.0998 | 12.1 | 64.4024 | 14.3026 |
We have assumed both titrant and titrated substance concentrations to be 0.1 M and initial volume of the acid to be 50 mL. Volumes marked green are less than 0.05 mL from the equivalence volume. ??? marks pH values that can be not obtained mixing given titrant and titrated substance solutions.
For 0.1M solution of acetic acid there is only one indicator (thymol blue) requiring less than 0.02 mL of base for a complete change of color. That is an obvious signal, that in the case of a weak acid we have to be very careful and titrate either to the first change of color, or to the complete change of color, depending on the indicator used. Steep area of the curve becomes too short and there is simply no place for pH change large enough for complete color change of most indicators. That's similar situation to the diluted strong acid.
Just for the sake of completeness we will also take a look at plots of titration of a weak diluted acid (0.001M acetic acid):
0.001 M acetic acid titrated with 0.001 M strong monoprotic base in the presence of the methyl red. Note that while only color change area is marked on the plot, solution is red for lower pH and orange for higher pH. Titration curve calculated with BATE - pH calculator.
0.001 M acetic acid titrated with 0.001 M strong monoprotic base in the presence of the thymol blue. Note that while only color change area is marked on the plot, solution is yellow for lower pH and blue for higher pH. Titration curve calculated with BATE - pH calculator.
0.001 M weak monoprotic acid titrated with 0.001 M strong monoprotic base in the presence of the phenolphthalein. Note that while only color change area is marked on the plot, solution is pink for higher pH. Titration curve calculated with BATE - pH calculator.
and table:
| indicator name | color change start pH | Vb (mL) | color change end pH | Vb (mL) | ΔVb (mL) |
|---|---|---|---|---|---|
| 2,4-Dinitro phenol | 2.8 | ??? | 4.7 | 21.9267 | ??? |
| Methyl orange | 3.1 | ??? | 4.4 | 12.7679 | ??? |
| Bromocresol green | 3.8 | ??? | 5.4 | 40.3733 | ??? |
| Methyl red | 4.4 | 12.7679 | 6.2 | 48.1994 | 35.4315 |
| Chlorophenol red | 4.8 | 25.0473 | 6.4 | 48.8509 | 23.8036 |
| Litmus | 5.0 | 31.0072 | 8.0 | 50.0705 | 19.0633 |
| Bromothymol blue | 6.0 | 47.2008 | 7.6 | 49.9656 | 2.7648 |
| Neutral red | 6.8 | 49.5417 | 8.0 | 50.0705 | 0.5288 |
| m-Cresol purple | 7.4 | 49.9076 | 9.0 | 51.0071 | 1.0995 |
| Thymol blue | 8.0 | 50.0705 | 9.6 | 54.1454 | 40.748 |
| Phenolphthalein | 8.2 | 50.1401 | 9.8 | 56.7340 | 6.5939 |
| Alizarin yellow GG | 10.0 | 61.1108 | 12.1 | ??? | ??? |
We have assumed both titrant and titrated substance concentrations to be 0.001 M and initial volume of the acid to be 50 mL. Volumes marked green are less than 0.05 mL from the equivalence volume. ??? marks pH values that can be not obtained mixing given titrant and titrated substance solutions.
It is not surprising, that when we combine weak acid and low concentration problems with correct end point determination become even more pronounced. Now even thymol blue can't be fully trusted and titration have to be ended at the first color change.
If we will take a look at all presented tables, we will notice that number of volumes marked green - that is those that are less then 0.05 mL from the equivalence volume - is smaller and smaller in each table. That supports our conlcusions - the lower the concentration and the weaker the acid, the more difficult is the indicator selection, and the more carefull we have to be during titration.
So, how do we select correct indicator? The most correct approach calls for the full analysis of the situation similar to that done above. Once we calculate volumes of titrant required to change colors of several indicators, we can select the one that changes color in the smallest distance from the equivalence volume. Depending on the analysis results we may have to titrate either to the first color change, or to the complete color change. For strong acids of concentrations around 0.1M it is not an issue - as we have shown earlier on the page, almost any indicator changing color between pH 4 and 10 will do.
Instead of performing full analysis, we may also try simpler and less accurate method - calculate pH of the titrated solution for 99.9% and 100.1% titration, and select indicator that changes color completely between those two points, or that at least starts to change color or ends change color in between. This way we can be sure our end point is ±0.1% from the equivalence point. Problem is, methods used for calculation of pH of such solutions are based on several assumptions, which are not necesarilly true for a weak and diluted acids. Thus they work correctly for solutions that don't require special attention, but they can fail for solutions that need detailed analysis. To avoid problems we can always try to use pH calculator which will always give correct results, as it doesn't use any simplifying assumptions when calculating pH.
There are two important remarks about the above discussion:
First, we have ignored ionic strength of the solution and activity changes. Problem was signalled in the end point indicators section. pKa of the indicator depends on the ionic strength of the solution, thus color change pH range shifts up or down, depending on the indicator. This shift can be in the 0.35 pH unit range, so in some cases it can't be neglected.
Second - phenolphthalein differs from all other mentioned indicators, as it has only one colored form. The other one - present in neutral solutions - is colorless (in fact there are more forms of phenolphthalein and some of them have other colors, but they require extreme pH values and we will usually not observe them during normal titration epxeriment). As we have already seen in the acid-base titration (pH) indicators section, pH at which such indicator changes color depends on the indicator concentration. Thus commonly given values for the phenolphthalein color change pH range - 8.2 to 9.8 - can slightly change depending on the amount of indicator added.
General idea: dilution and/or weak acid -> shortening of the steep part of the curve -> necessity to end titration much closer to the equivalence point.